Backtesting software: test a strategy on real prices
Backtesting software shows how a trading strategy or a portfolio would have done on past prices. Tactfolio backtests both on daily prices of US-listed stocks and ETFs, with dividends reinvested and a cost on every trade. It also backtests Hyperliquid crypto perps, such as BTC, on daily or hourly prices. It is free, and you can look around without an account.
- Test a fixed mix, like 60% stocks and 40% bonds, or rules that change what you hold.
- Prices are daily and adjusted for splits and dividends. Every trade pays a 0.05% cost.
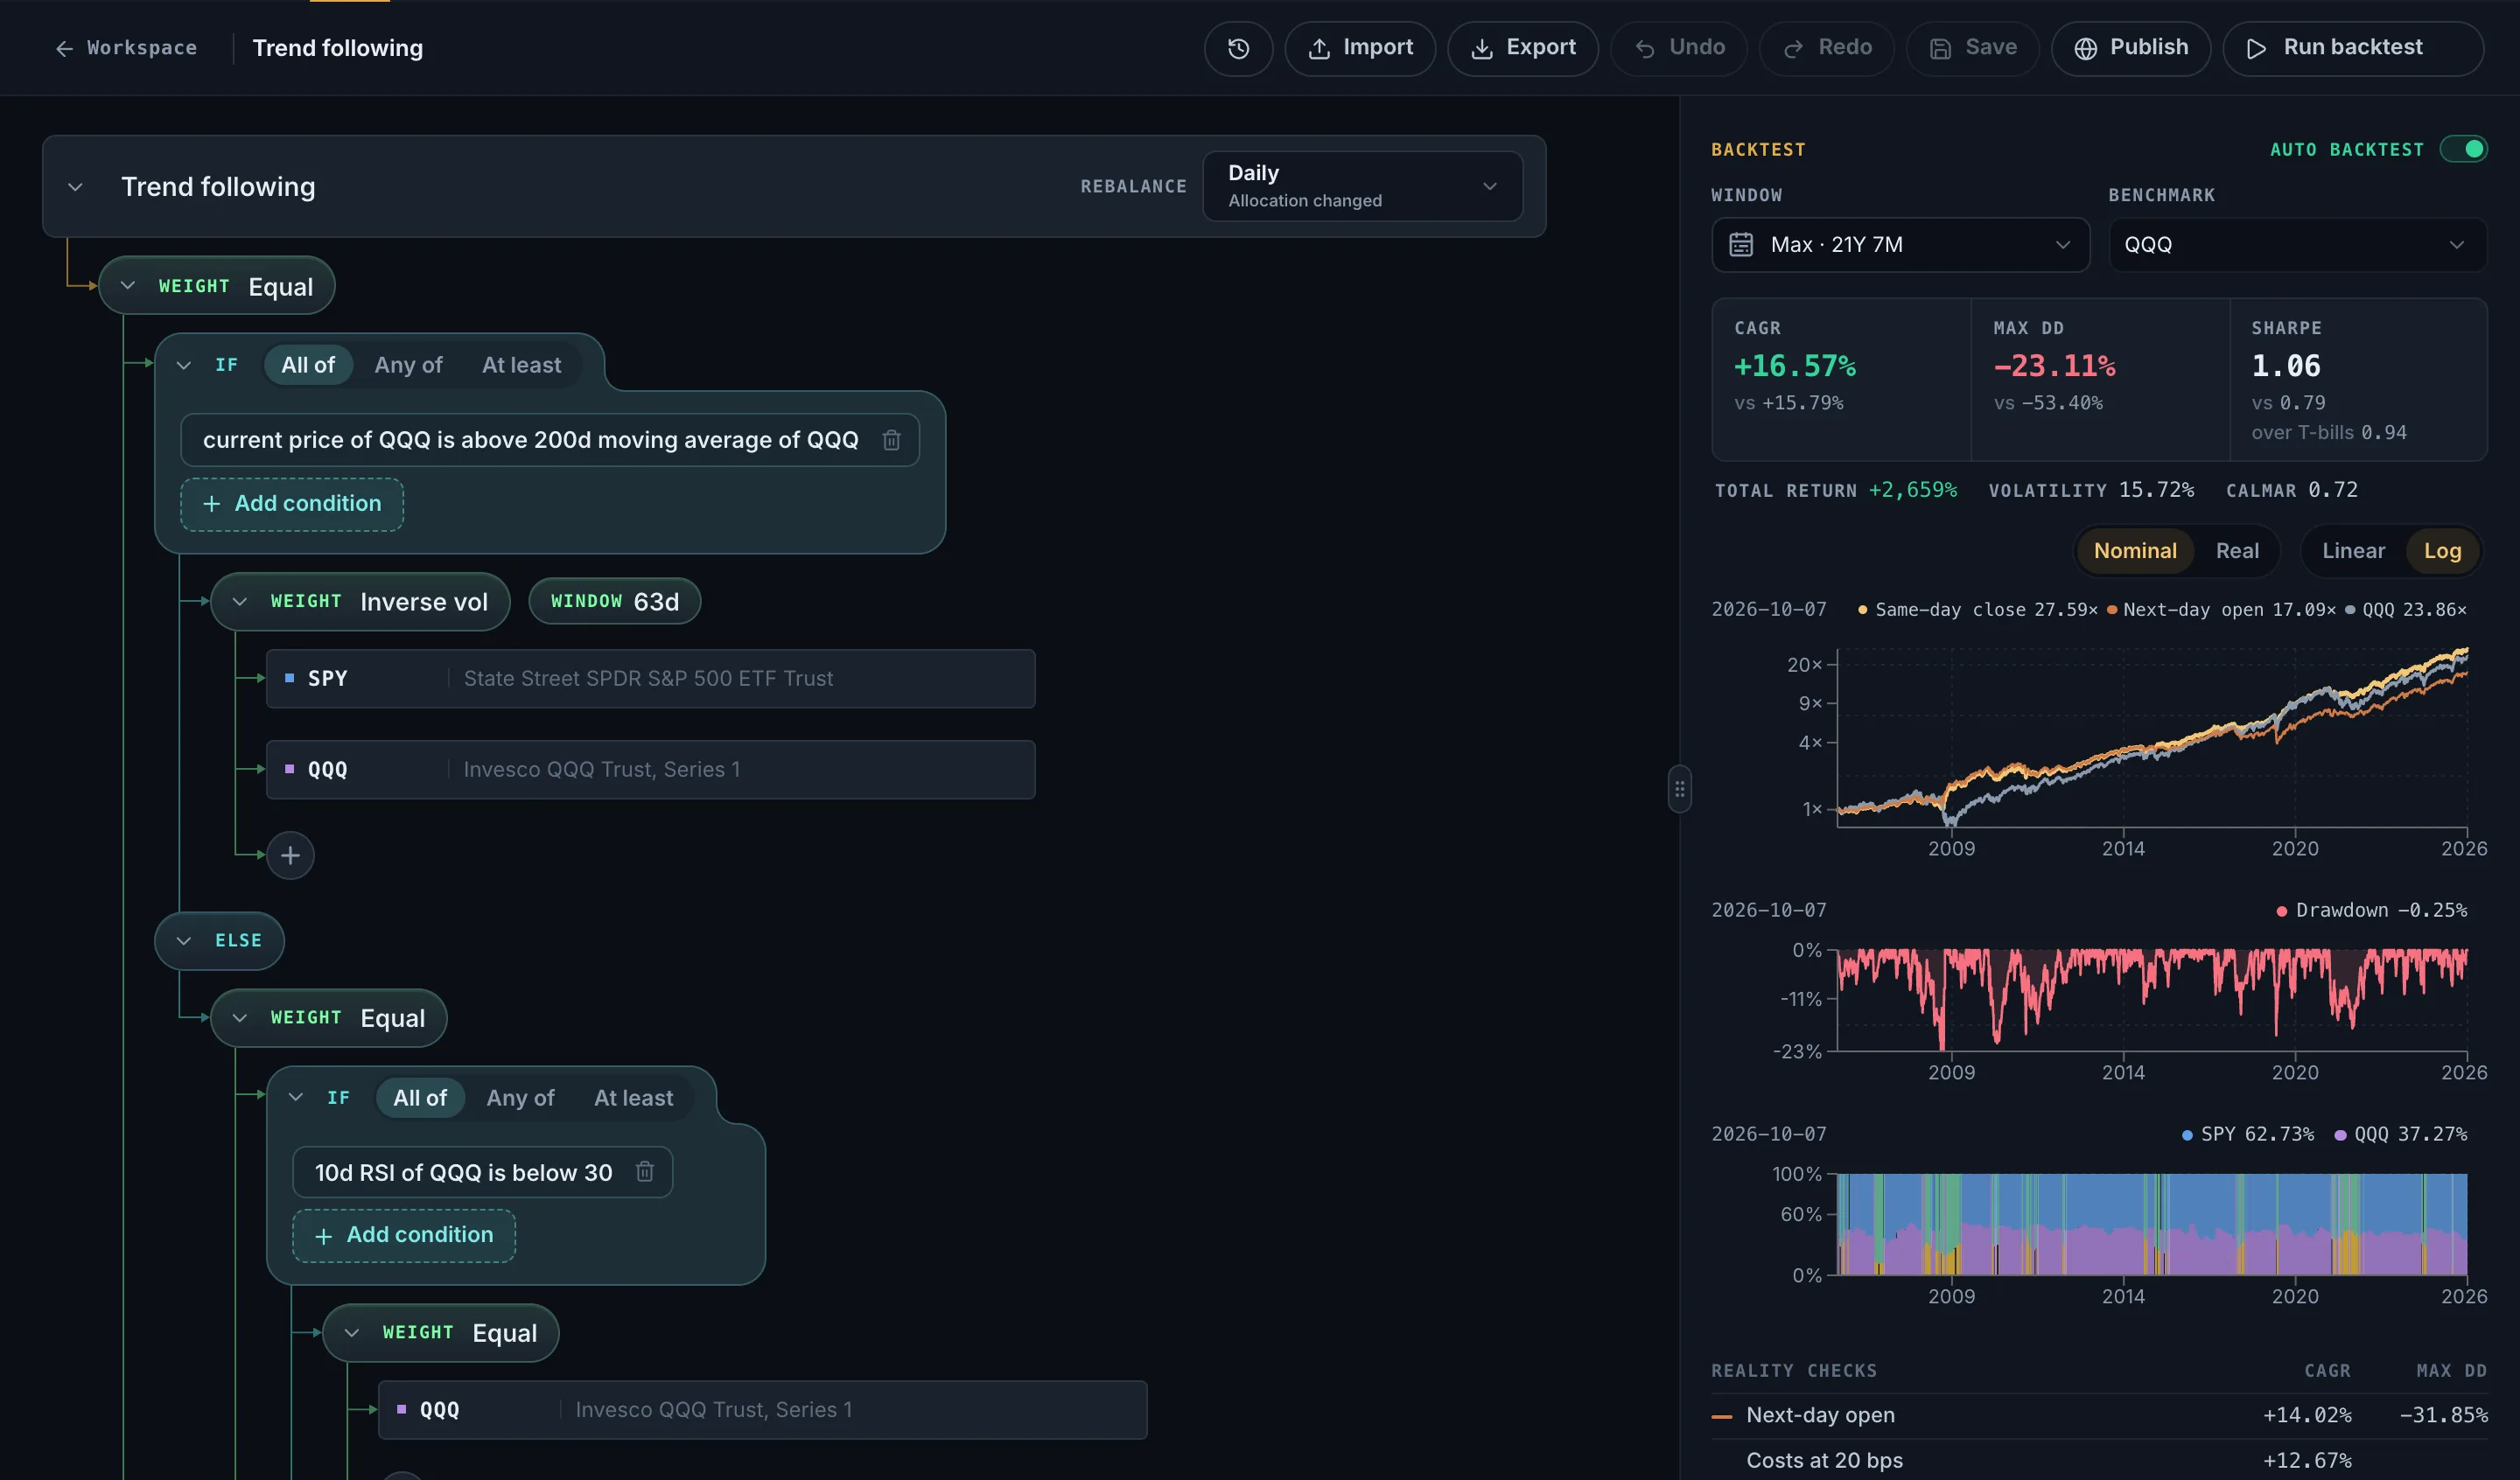
- Each backtest shows growth, the deepest fall, what it held and when, and a benchmark over the same dates.
- A next-day-open line and a “Reality checks” table show how fragile a result is.
- A backtest is hypothetical. It can’t tell you what happens next.
Open the builderFree while we build. Look around without an account.
What is backtesting?#
Backtesting means testing a plan on past data, as if you had followed it at the time. The SEC’s investor site describes it the same way, and adds a warning: back-tested performance is hypothetical and does not reflect actual performance.
A backtest answers questions like these:
- How much would $1 have grown?
- How far did it fall in the worst year?
- How often did it trade?
- Did it beat holding the S&P 500 over the same dates?
How to backtest a trading strategy on Tactfolio#
- Open the builder. Go to the builder. You can look at four starter patterns and their last 10 years without an account.
- Add what you want to hold. Add tickers, such as SPY for US stocks and IEF for Treasury bonds. Put them in a Weight block and set the split, such as 60% and 40%.
- Add rules if you want them. An If block can switch holdings when a condition is true. A Rank block can hold the strongest few funds.
- Pick dates and a benchmark. A benchmark is what you compare against, such as holding SPY alone.
- Read the results. The backtest reruns every time you change a number. Save your strategy with a free account, and every save is kept.
The getting started guide walks through a first strategy in about 10 minutes.
What a Tactfolio backtest includes#
Every backtest uses the same rules, so results are fair to compare. The full list is in what a backtest simulates.
| Part of the test | What Tactfolio does |
|---|---|
| Prices | Daily prices of US-listed stocks and funds, adjusted for splits and dividends |
| Trade timing | Trades at the same day’s close as the signal, plus a next-day-open line to compare |
| Costs | 0.05% (5 basis points) on every trade, the same for every strategy |
| Crypto perps | Hyperliquid perps on daily or hourly prices, with funding counted in the price. Backtest and paper or testnet only |
| Economic data | US data from the Federal Reserve Bank of St. Louis (FRED), usable in rules |
| Young funds | Optional simulated history reaches further back, clearly labeled |
| Benchmarks | Any ticker you pick, over exactly the same dates |
| Reality checks | The same trades at higher costs, and the benchmark held at your level of risk |
A worked example: dual momentum#
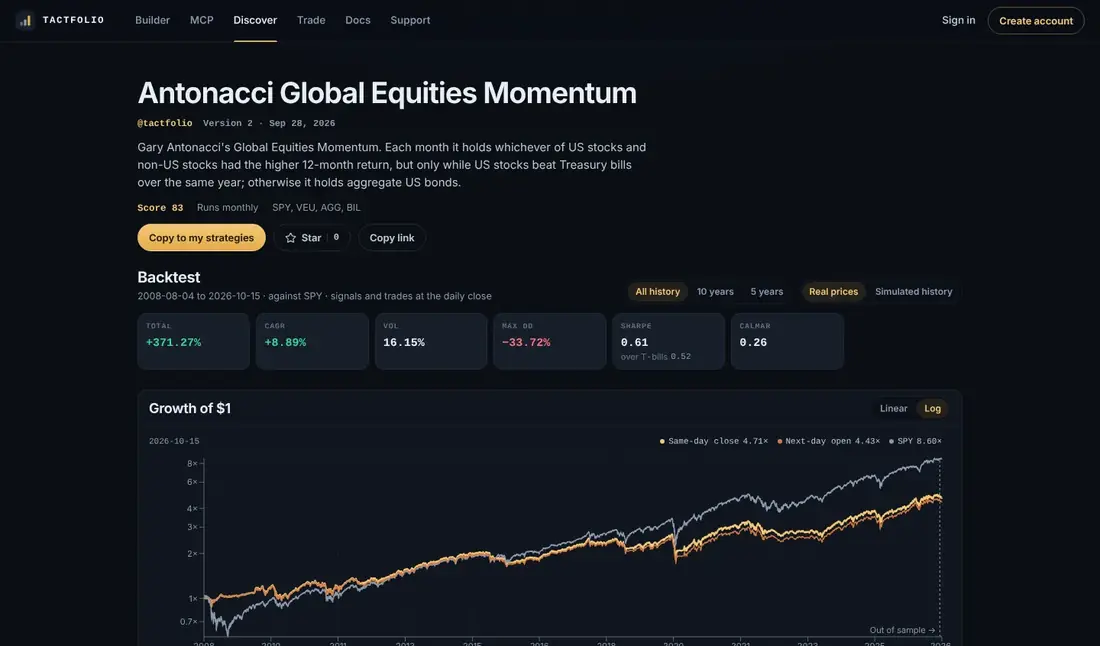
Here is a real backtest, with the awkward part first. Gary Antonacci’s dual momentum strategy grew less than holding the S&P 500 over the ETF era. It fell less in its worst drop, though.
Each month, the strategy holds US stocks or stocks outside the US, whichever did better over 12 months. If US stocks did worse than Treasury bills, it holds bonds instead.
| Measure | Dual momentum (live version) |
|---|---|
| Backtest period | August 4, 2008 to October 15, 2026 |
| Yearly growth (CAGR) | 8.89% |
| Worst fall (max drawdown) | 33.72% |
| $1 grew to | $4.71 trading at the close, $4.43 at the next day’s open |
| $1 in SPY grew to | $8.60 over the same dates |
Figures as of October 15, 2026, from the live strategy page, using daily prices with dividends reinvested and a 0.05% cost per trade. These results are hypothetical.
CAGR is the average yearly growth rate. Max drawdown is the biggest fall from a high point to a later low. The next-day-open line is lower, which shows that the result depends a little on trading at the exact close.
Common backtesting mistakes#
A backtest can fool you. These are the usual traps.
- Testing too many versions. Try enough rules and one will look great by luck. This is called overfitting.
- Ignoring costs. Rules that trade often can lose their edge to costs.
- Using a short window. Ten good years can hide a bad decade.
- Looking ahead by accident. A rule must only use prices it could have seen at the time. Tactfolio’s engine never lets a rule see a later day.
- Forgetting how it felt. A 30% drop is a number in a table. Living through it is harder.
Why past results mislead covers each trap and how to guard against it. How to read a backtest explains every number in the results.
What Tactfolio does and does not do#
| Tactfolio does | Tactfolio does not |
|---|---|
| Backtest fixed mixes and rules-based strategies on daily prices | Backtest options, forex, or crypto coins you buy and hold |
| Backtest Hyperliquid crypto perps on daily or hourly prices | Trade crypto with real money |
| Reinvest dividends and charge a cost on every trade | Test stocks during the day, or minute by minute |
| Show a next-day-open line and reality checks | Call a backtest a track record |
| Let you run a tested strategy on paper or with Alpaca | Work with any broker other than Alpaca |
| Hold leveraged and inverse ETFs like any other fund | Test short selling or margin borrowing |
Try it on Tactfolio#
Open the builder and start from a pattern or a blank canvas. If you would rather start from a tested idea, open one of the 62 classic strategies and copy it. When a backtest looks good, paper trade it to see how it does on new prices.
Open the builderFree while we build. Look around without an account.
Keep learning#
- Backtesting explained: the idea in plain words, with the traps to avoid.
- Max drawdown and Sharpe ratio: two numbers to read on every backtest.
- Momentum strategy: the idea behind the dual momentum example above.
- Backtest a portfolio and the CAGR calculator: free tools for a fixed mix and a yearly rate.
- Best portfolio backtesting tools and Tactfolio vs Portfolio Visualizer: how Tactfolio compares.
Common questions#
Is backtesting free on Tactfolio?#
Yes. Everything is free while we build. Without an account, you can see the starter patterns and every public strategy’s backtest. To run your own backtests and save them, you need a free account.
How far back can I backtest?#
It depends on the tickers you use. SPY prices start in 1993, and many funds start later. A backtest begins once every ticker has prices. For some young funds, simulated history can reach further back.
Crypto perps have less history. Hyperliquid’s daily prices start with BTC in August 2020, and hourly prices cover a much shorter time. Perps that track a stock or gold can use simulated history from the asset they track.
Why are my results different from another backtesting site?#
Small choices add up. The usual causes are trade timing, trading costs, whether dividends are reinvested, and how the Sharpe ratio is figured. Our FAQ lists each one.
Can I backtest a stock portfolio, not only ETFs?#
Yes. Tactfolio backtests US-listed stocks and funds. You can mix single stocks and ETFs in one strategy.
Can I backtest crypto on Tactfolio?#
Yes, through Hyperliquid perps such as BTC and ETH, on daily or hourly prices. Crypto is backtest and paper or testnet only. A strategy holds either stocks and ETFs or perps, never both. Crypto backtesting covers funding, bars, and history.
Is a good backtest proof that a strategy works?#
No. A backtest shows how rules would have done on prices that already happened. Rules often do worse afterwards. Test on dates the rule was not built on, and paper trade it before you use real money.
Sources
- Investor Bulletin: Performance Claims, U.S. Securities and Exchange Commission, Investor.gov, accessed October 16, 2026